The Johns Hopkins Coronavirus Resource Center has launched a new data visualization tool that gives an indication of the impact of state’s policy decisions, a release that comes as COVID-19 cases are on the rise in many states across the U.S.
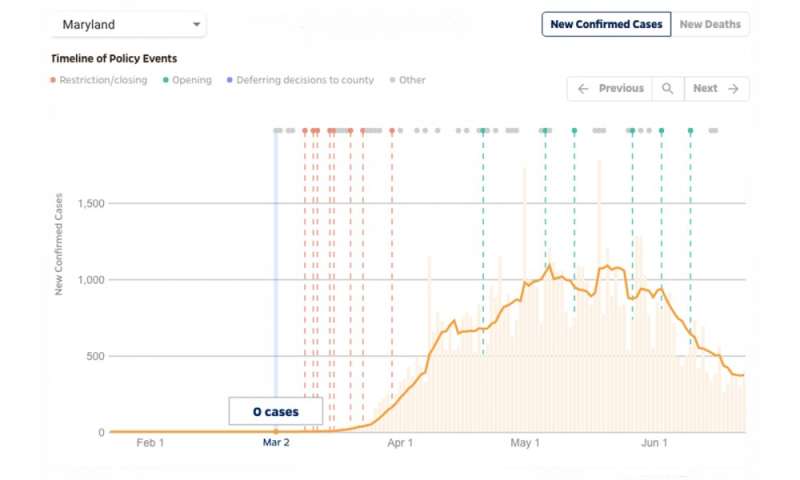
New graphics show a timeline of the major infection control measures and re-openings in each state with an overlay of trendlines for new cases and deaths in that state. Users can see whether COVID-19 cases and deaths are increasing, decreasing, or remaining constant in each state, providing insight into the impact of closures and highlighting spikes associated with state-level re-openings.
“As COVID-19 continues to move through states and communities, it’s important to understand which control measures might impact virus transmission,” said Beth Blauer, executive director of the Centers for Civic Impact at Johns Hopkins. “These data may be able to help officials make decisions about whether to roll back or reinstate infection control policies as the pandemic evolves.”
On Wednesday, the U.S. recorded its highest single-day total of new infections since late April with nearly 35,000 new cases. California, Florida, and Texas all reported more than 5,000 new cases on Wednesday.
Federal guidelines advise states to wait until they see a downward trajectory of documented cases over a 14-day period before proceeding to a phased opening. Lifting social distancing measures prematurely, while cases continue to increase or remain at high levels, could result in a resurgence of new cases, public health experts caution.
“Political leaders in every state have an enormous ability to shape the trajectory of this pandemic through the policy decisions they make,” said Jennifer Nuzzo, senior scholar at the Center for Health Security and associate professor of Epidemiology at the Johns Hopkins Bloomberg School of Public Health.
“In order to better interpret and anticipate trends in states’ case numbers, we need to understand what policies these leaders are implementing in response to COVID-19 and to evaluate the impact of these policy decisions. This tool helps us do that by documenting these policy changes and allowing us to view them in the context of each state’s epidemic.”
The new data visualization tool is the latest product of a multidisciplinary collaboration among experts from across Johns Hopkins. The Johns Hopkins Coronavirus Resource Center hosts expert insight on the pandemic from every division of Johns Hopkins, and is led through a partnership between the Johns Hopkins Centers for Civic Impact, the Bloomberg School of Public Health, the Johns Hopkins Applied Physics Laboratory, and the Whiting School of Engineering. These efforts are also backed by the support of Bloomberg Philanthropies and the Stavros Niarchos Foundation.
Source: Read Full Article